Plotting equations
Plotting graph of equations and their intersection
An app to show how to plot the graph of a given function equation. Extending it further to plot the points that lie on the intersections of the given functions. Key learnings:
- Treating graph plotting as an optimization problem.
- Defining suitable function for the given problem. e.g. intersection

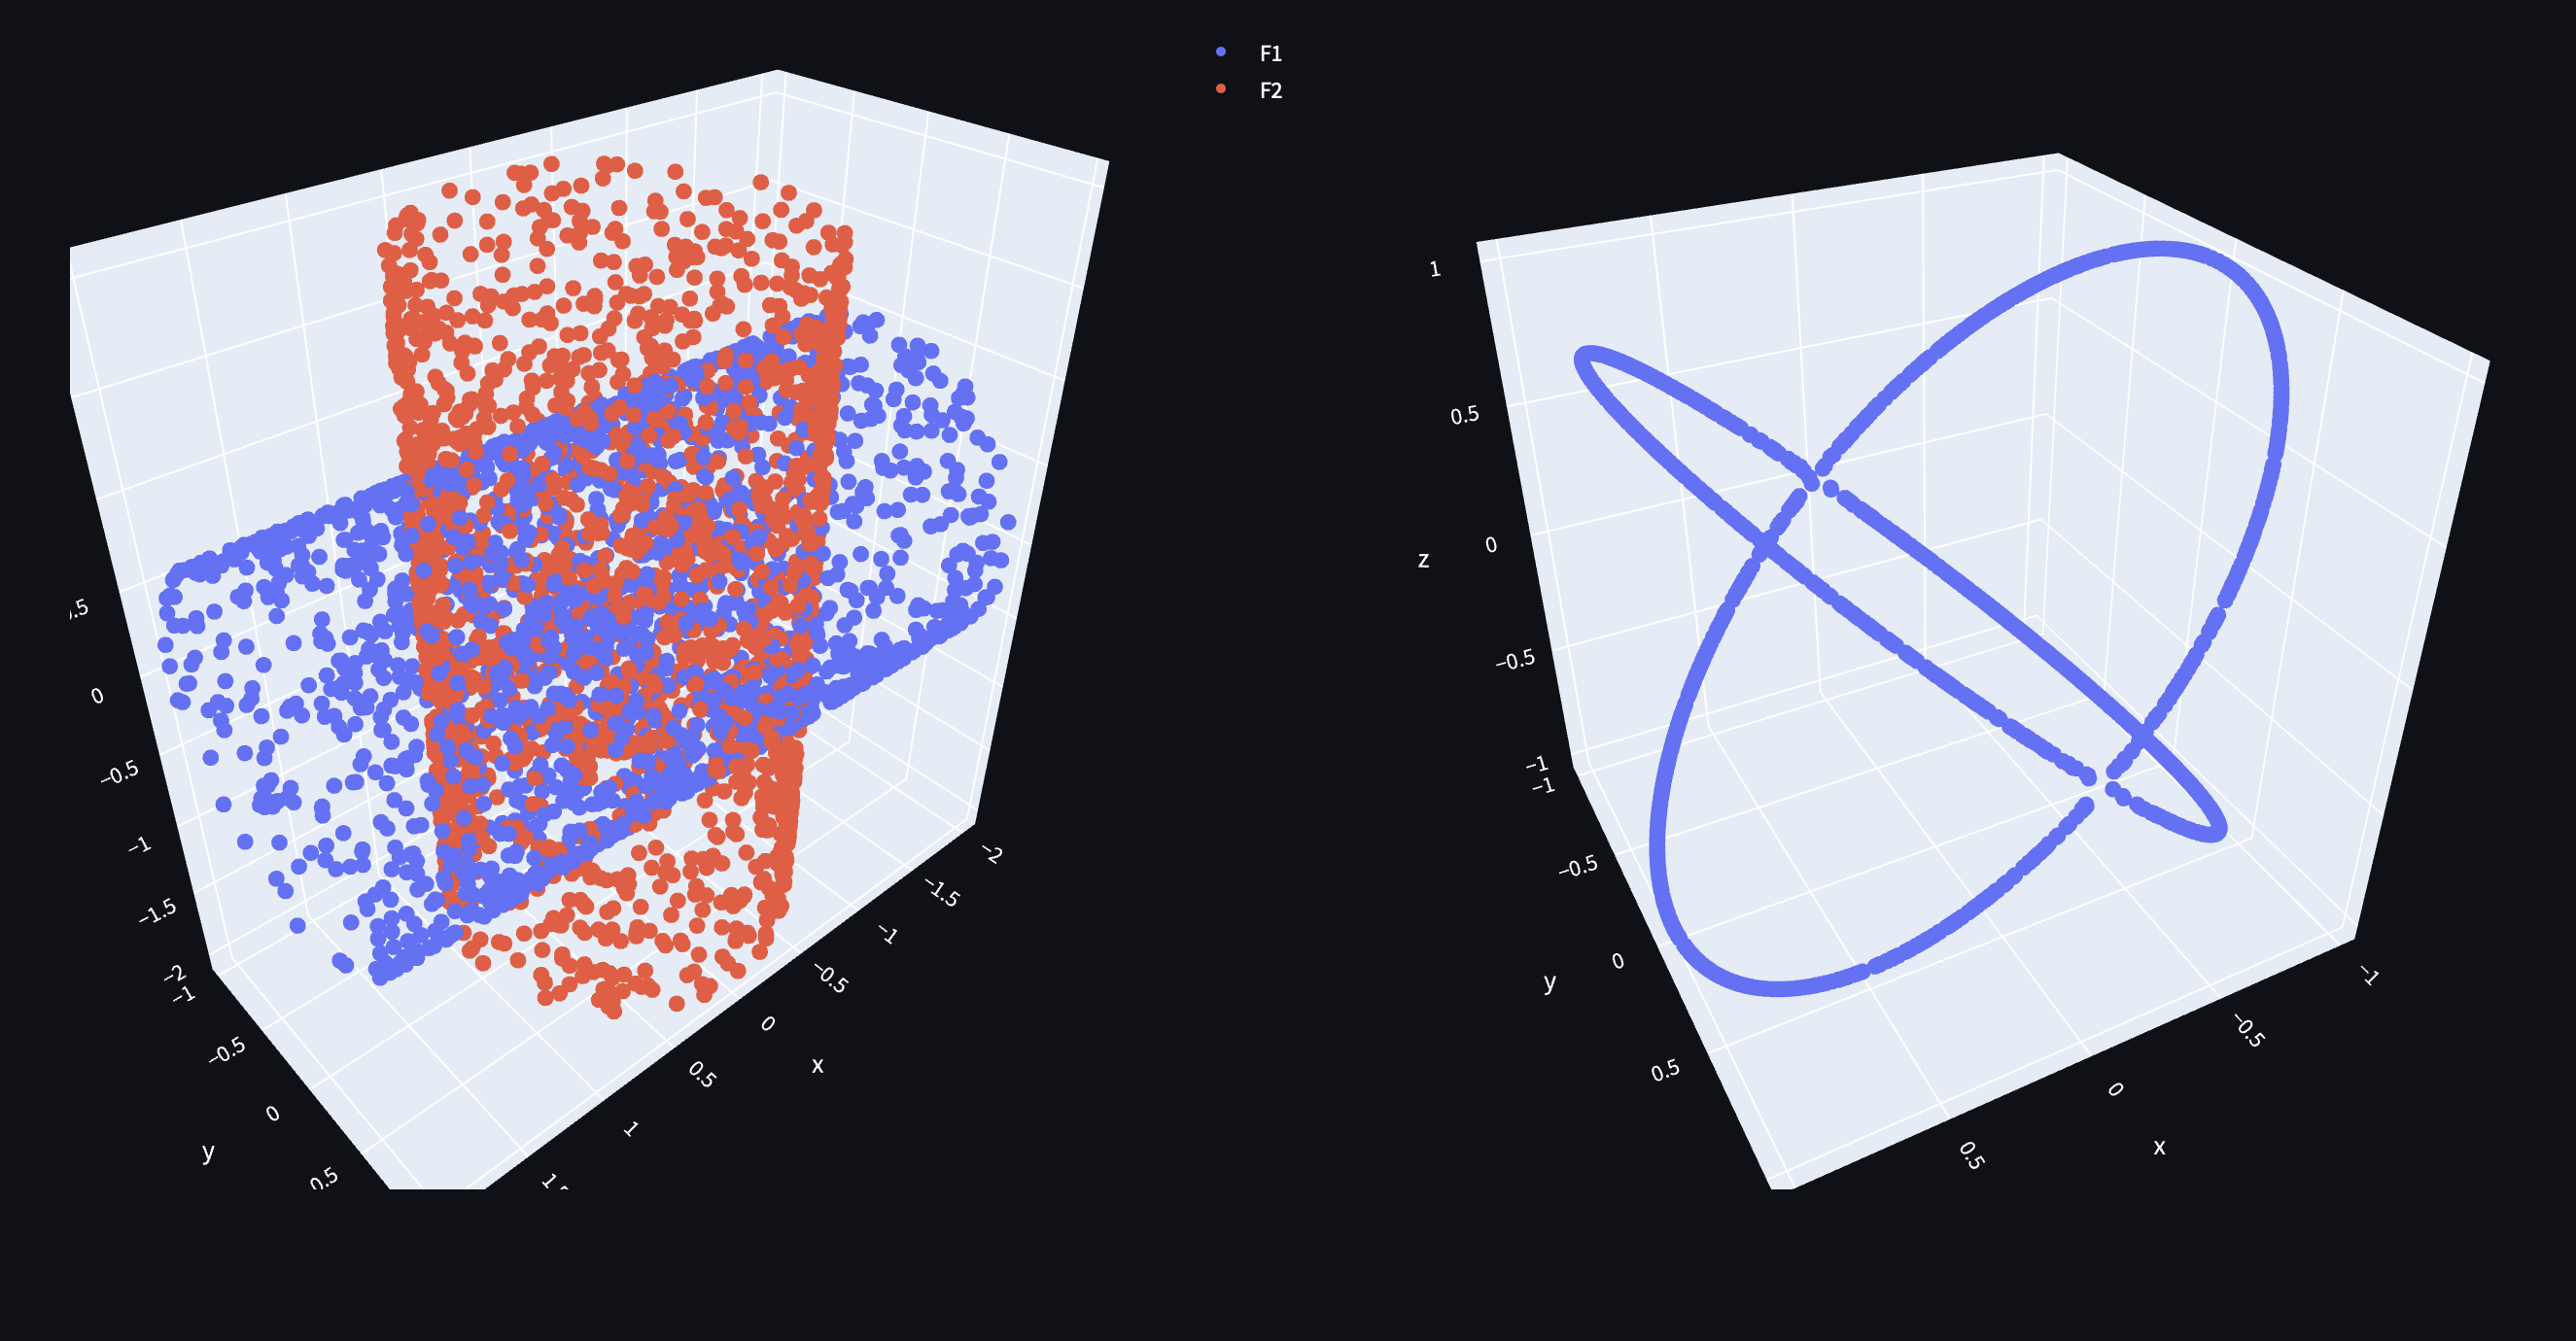
2 cylinders and their intersection.

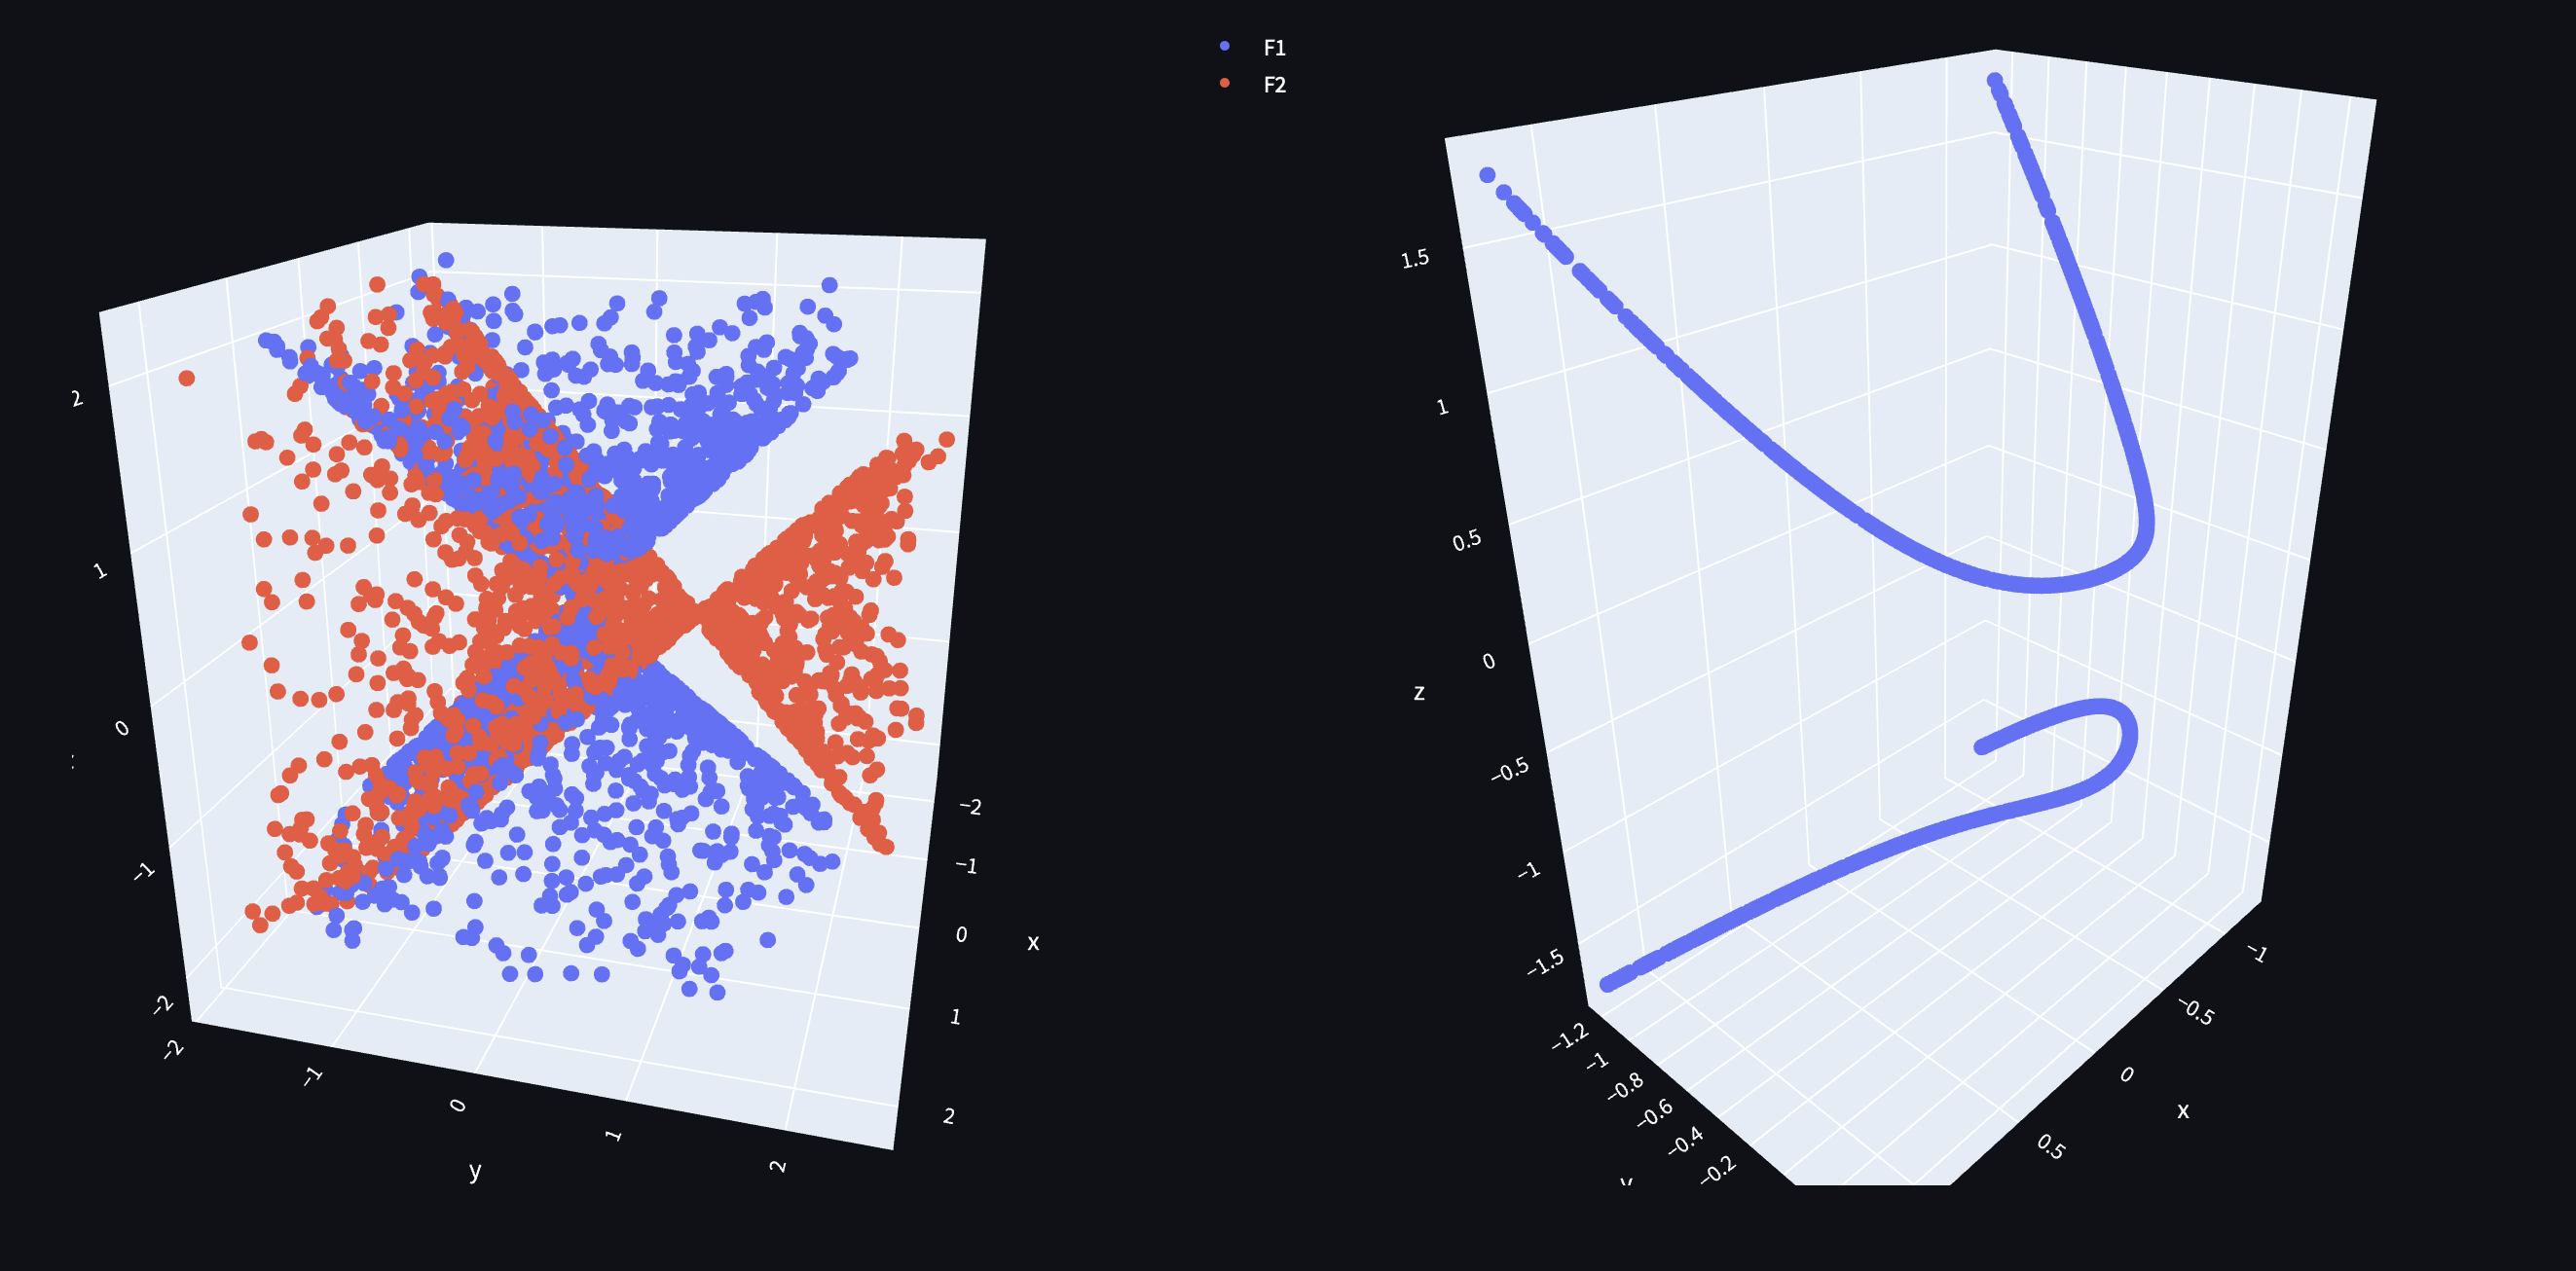
2 double-cones and their intersection.

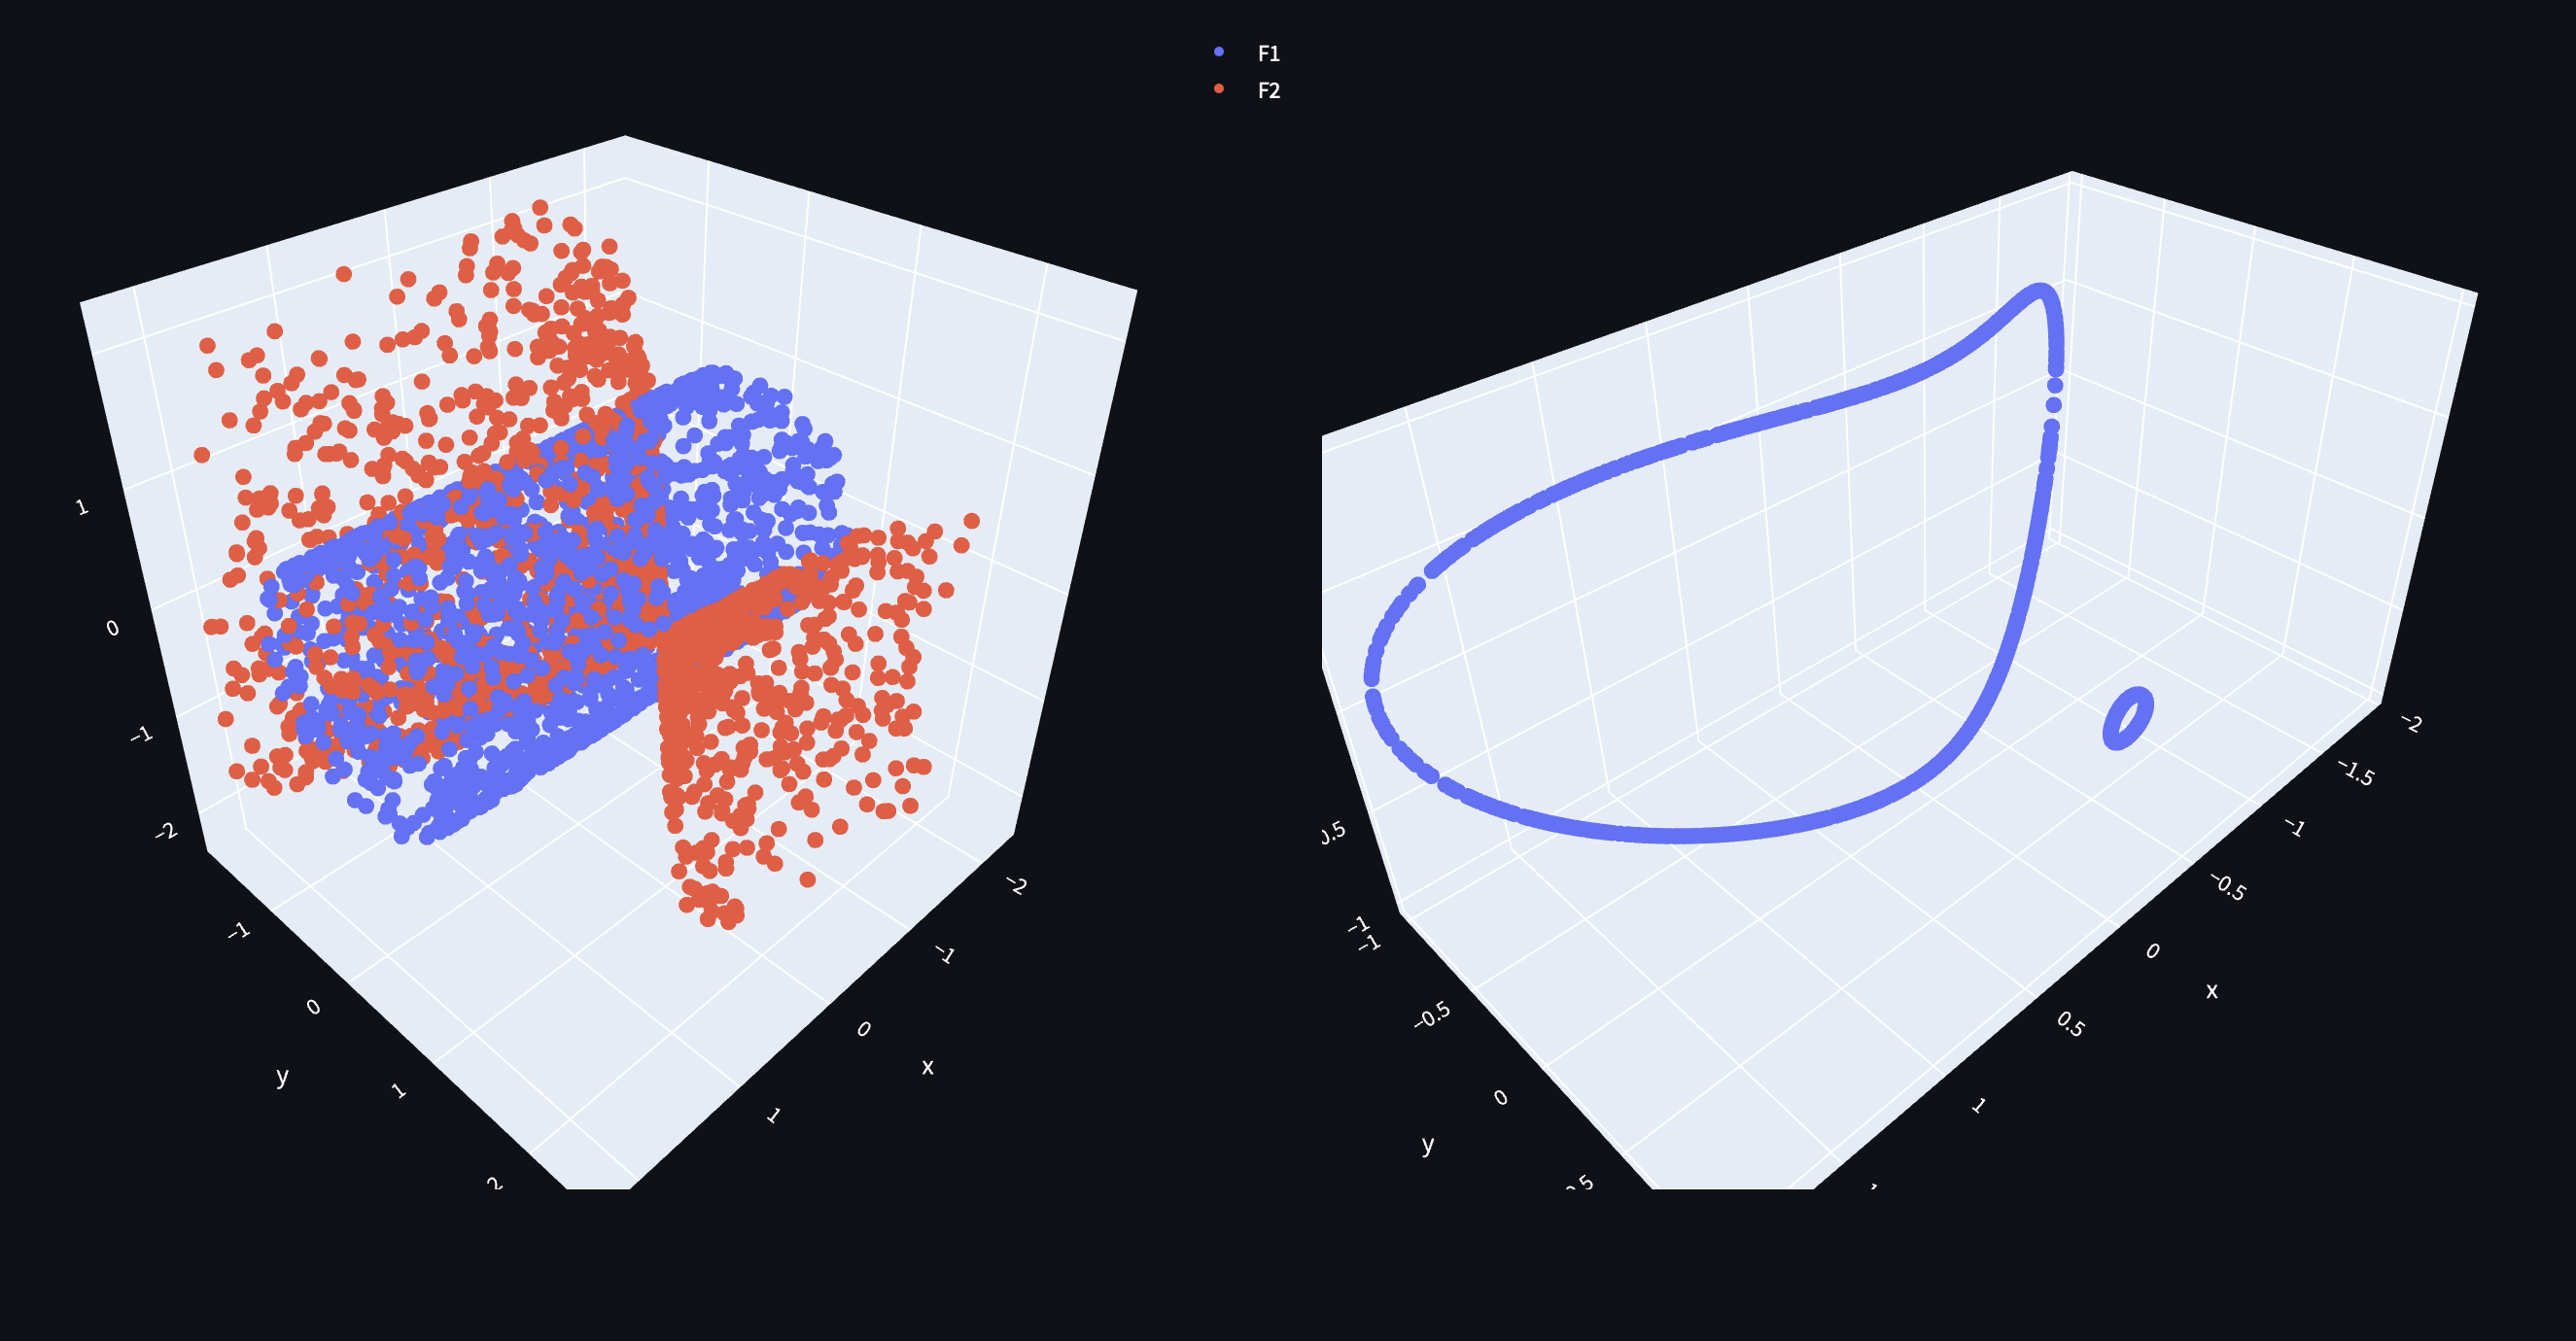
double-cone and cylinder with their intersection.